New Relic Synthetics Performance Monitoring Guide
Learn New Relic Synthetics for performance monitoring, scripted browser checks, user-agent details, and APM integration. Complete technical guide.
Introduction
New Relic Synthetics is a performance monitoring tool that simulates user interactions with your website or application. It runs automated tests from various global locations to check if your site is working properly. Known as synthetic monitoring, it generates fake traffic to assess your systems before real users encounter issues. The tool aids developers and businesses in catching problems early, conducting uptime monitoring, and understanding application performance from different geographic locations. New Relic Synthetics seamlessly integrates with the broader New Relic platform, which includes APM (Application Performance Monitoring), infrastructure monitoring, and logging tools. Key features consist of scripted browser checks, API tests, simple ping monitors, and detailed performance reports showing response times and availability metrics.
What is New Relic Synthetics
Synthetic Monitoring Process:
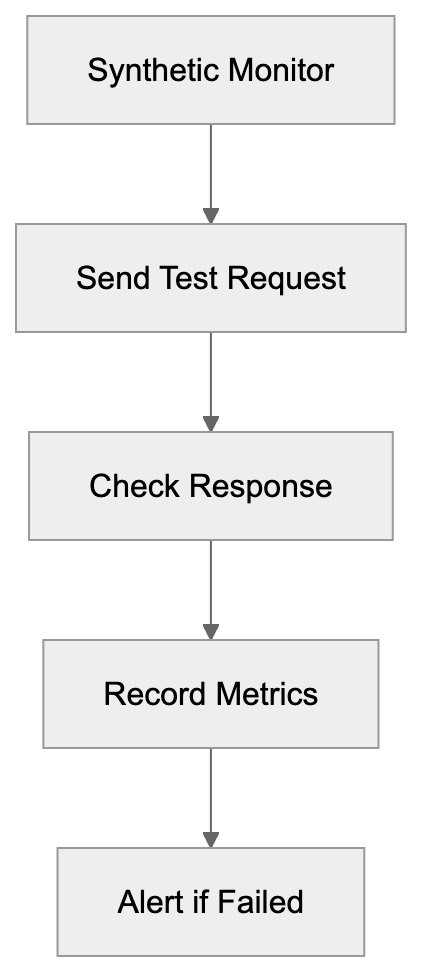
New Relic Synthetics is a cloud-based monitoring service that automatically checks your websites and APIs. It functions by sending repeated requests to your endpoints at regular intervals from servers in various global locations. Consider it a robot visiting your website every few minutes to ensure everything functions correctly. The service conducts various checks: simple ping tests to verify server responsiveness, scripted browser tests that simulate user interactions, and API tests that validate backend services. When a malfunction or slow response occurs, New Relic Synthetics alerts your team instantly. The tool records comprehensive data from each test, including screenshots, response times, and error messages, stored in the New Relic platform for analysis alongside other application and infrastructure monitoring data.
Why Synthetic Monitoring Exists
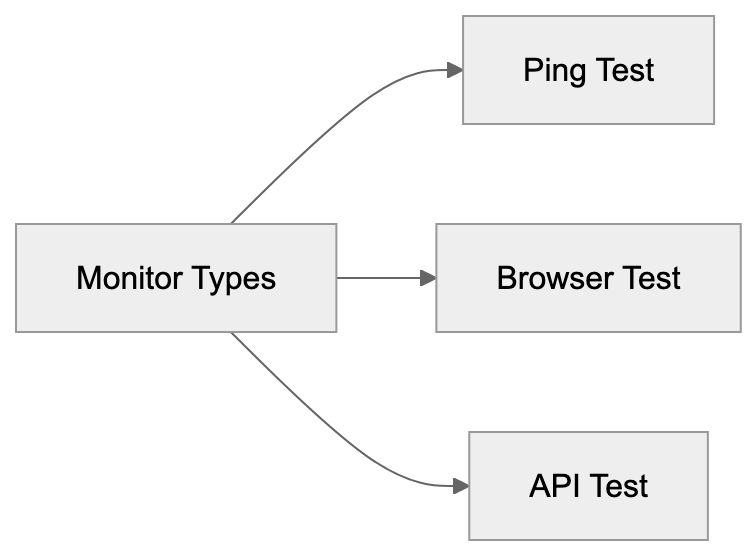
Monitor Types Overview:
Synthetic monitoring addresses a crucial challenge for modern web applications. You must know if your site is down or slow before customers complain. Traditional monitoring only reveals issues when real users visit your site, but what if no one visits during a significant outage at 3 AM? Synthetic monitoring bridges this gap by continuously testing your systems, even without real traffic. It also lets you test user journeys that may not occur often but are critical to your business. For instance, scripting a test that runs through your entire checkout process every 10 minutes ensures customers can complete purchases anytime. Additionally, it enables geographic testing, revealing performance issues from locations outside your immediate environment. This data helps establish performance baselines and track improvements over time.
How Companies Use New Relic Synthetics
Companies deploy New Relic Synthetics in multiple practical ways. E-commerce businesses conduct scripted browser checks that simulate the comprehensive shopping experience, from product browsing to checkout, ensuring revenue-generating paths function seamlessly. SaaS firms utilize API monitoring for checking authentication endpoints, data services, and customer-dependent APIs. Development teams execute synthetic checks on staging environments pre-deployment, catching broken functions before affecting real users. Operations groups set up ping monitors on infrastructure components like DNS servers, load balancers, and CDN endpoints. When synthetic monitors identify issues, they trigger alerts through email, Slack, PagerDuty, or other notification systems. The monitoring data integrates with New Relic APM, offering extensive visibility into application code performance, allowing teams to correlate synthetic test failures with specific code or infrastructure problems.
New Relic Synthetics User-Agent String
When New Relic Synthetics tests your website, it uses a user-agent string in HTTP request headers to identify itself. For scripted browser checks using Chrome, the user-agent string typically includes “Chrome” with version information and “NewRelicSynthetics” or related identifiers. This identification serves several purposes: it helps website owners distinguish synthetic from real user traffic in analytics, allows exceptions for monitoring traffic by bypassing features like rate limiting, and aids in debugging by identifying requests in server logs as benign monitoring rather than malicious traffic. Different monitor types send variant user agents, with simple ping monitors using minimal data, while scripted browser tests include full browser user-agent strings with the New Relic identifier.
Integration with APM and Other Tools
New Relic Synthetics operates as part of the broader New Relic observability platform, boasting robust APM integration. If a synthetic check fails or slows, you can see associated APM traces, revealing exact application code operations during those tests. For instance, if a scripted checkout takes 10 seconds over the usual 2, APM data might show a slow database query or external API call causing the delay. The platform also correlates synthetic monitoring data with infrastructure metrics, logs, and distributed tracing, all appearing in a unified interface with customizable dashboards. You can create charts overlaying synthetic response times with server CPU usage or error rates. Integration extends to incident management tools. Failed checks can automatically create PagerDuty incidents, trigger Slack notifications, create Jira tickets, or send webhooks. The API lets you manage monitors programmatically, retrieve results, and integrate synthetic monitoring into CI/CD pipelines.
Comparison with Alternative Monitoring Tools
Several alternatives offer synthetic monitoring capabilities. Here’s how New Relic Synthetics compares to major options:
| Feature | New Relic Synthetics | Datadog Synthetics | Pingdom | Uptime Robot | StatusCake |
|---|---|---|---|---|---|
| Scripted Browser Tests | Yes | Yes | Limited | No | No |
| API Monitoring | Yes | Yes | Yes | Yes | Yes |
| Global Locations | 20+ | 30+ | 100+ | 10+ | 30+ |
| APM Integration | Deep integration | Deep integration | None | None | None |
| Pricing Model | Usage-based | Usage-based | Tiered plans | Freemium | Freemium |
| Mobile App Testing | Yes | Yes | No | No | No |
| Screenshot Recording | Yes | Yes | Yes | No | Yes |
| Custom Scripting | JavaScript | JavaScript | Limited | No | No |
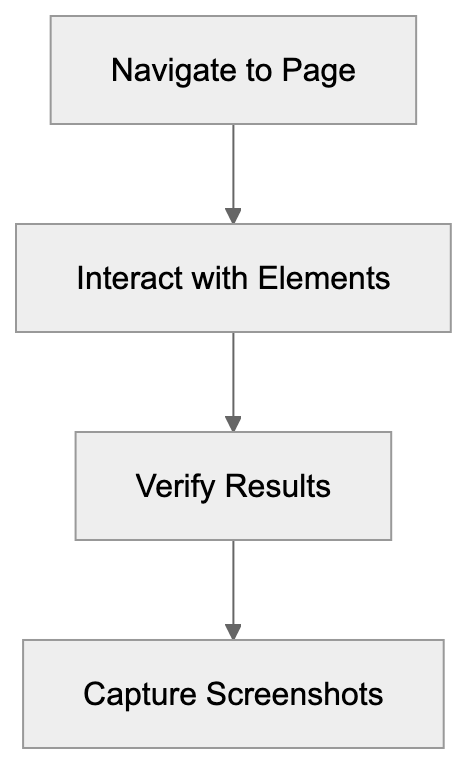
Scripted Browser Check Flow:
New Relic Synthetics shines for its seamless integration with the entire New Relic platform. For those already using New Relic APM, adding Synthetics offers a comprehensive monitoring solution. Datadog provides similar unifying observability with competitive scripting features. Pingdom is more focused on uptime monitoring with broader check locations but less robust scripting capabilities. Uptime Robot and StatusCake are budget-friendly, offering basic uptime checks with simpler feature sets, ideal for smaller projects but lacking advanced scripting. Selection depends on your monitoring stack, budget, and complexity needs. Teams deeply invested in the New Relic or Datadog ecosystems benefit most from their integrated synthetic monitoring.
Scripted Browser Checks Explained
Scripted browser checks are the powerhouse feature in New Relic Synthetics. These involve using a real Chrome browser controlled by Selenium WebDriver to interact with your site. Scripts, written in JavaScript, direct the browser’s actions. A typical script might navigate to your homepage, click a login button, input credentials, submit a form, and verify the user dashboard loads. The script checks for specific text, confirms element existence, measures action durations, and captures screenshots at each step. Failures like missing buttons or unexpected text result in alerts. Scripts can manage complex scenarios, including multi-step forms, file uploads, JavaScript-heavy apps, and multi-page user workflows. Each check runs from your selected locations at specified intervals, usually ranging from 1 minute to 24 hours depending on the functionality’s criticality. Results offer timeline data, showing step durations, network request info, console logs, and screenshots, simplifying debugging over basic uptime pings.
Monitor Types and Use Cases
New Relic Synthetics provides various monitor types for diverse testing needs. Ping monitors send simple HTTP requests to verify a URL’s responsiveness, suitable for basic uptime monitoring. They execute quickly with minimal resources. Simple browser monitors load a webpage in a browser, confirming successful loads, unlike ping monitors, as they execute JavaScript and uncover render-specific issues. They suit standard web page monitoring. Scripted browser monitors deliver the discussed prowess for complex interaction testing. API monitors test REST APIs, SOAP services, or GraphQL endpoints, with configurable request methods, headers, bodies, and expected response assertions. Certificate checks ensure SSL certificates won’t expire soon. Step monitors test action sequences without custom scripts, using a visual interface for step definition. Choosing the right monitor depends on the verification needed. Start with simple monitors for basic checks and use scripted monitors for functionality or user paths testing.
Setting Up Your First Monitor
Creating a monitor in New Relic Synthetics begins in the Synthetics section of the New Relic platform. Click “Create monitor” to choose your type. For a simple browser monitor, input the URL and select test locations, with public options across North America, South America, Europe, Asia Pacific, and beyond. Private locations support internal applications behind firewalls. Next, configure test frequency. Frequent checks incur higher costs but detect issues quicker. Establish alert conditions for failure notifications, such as multiple location failures, exceeded response time thresholds, or prolonged failures. Choose alert recipients, including emails, Slack channels, or incident management platforms. For scripted monitors, input or paste JavaScript into the script editor, with examples and documentation for common tasks. Test scripts before saving. Monitors start running instantly with results in the Synthetics dashboard within minutes.
Performance Metrics and Reporting
New Relic Synthetics tracks multiple key metrics for each monitor. Duration measures complete check time from start to finish. For scripted monitors, this includes all step times combined. Response time assesses server response to requests. Uptime percentage indicates check success rates, such as 99.9% uptime, signifying only 0.1% failures. The platform calculates Apdex scores, representing user satisfaction based on response times. Scores range from 0 to 1, where 1 indicates all responses met satisfaction thresholds. Success rate shows error-free check completion percentages. Geographic data details performance by test location, revealing regional issues. Reports display trends over time—daily, weekly, and monthly. Compare current performance against historical baselines, and create custom dashboards displaying synthetic monitoring alongside other metrics. Export data via API for external tool or data warehouse analysis.
Pricing and Resource Consumption
New Relic Synthetics’ pricing is based on monthly check volumes, where each monitor execution is one check. A monitor running every 5 minutes performs 288 checks daily or about 8,640 monthly from one location. Running from three locations triples this to 25,920 monthly. New Relic offers varying tiers with included check volumes, with extra checks incurring per-check charges. Scripted browser checks typically cost more than simple pings due to their computational demands. Pricing varies; check New Relic’s current pricing page for specifics. Private locations need containerized software on your infrastructure, incurring additional costs. Plan monitor deployments by balancing check frequency against cost. Critical paths might warrant 1-minute checks, while less critical endpoints could be 15-minute or hourly. Some start with longer intervals, reducing only for frequently problematic monitors. Value comes from preventing outages and poor user experiences. Calculate potential outage-driven revenue loss to justify monitoring costs.
Best Practices and Common Pitfalls
Successful synthetic monitoring requires thoughtful setup. Prioritize monitoring high-value user journeys and business processes rather than everything at once. Write stable scripts accommodating minor page changes. Use element IDs or data attributes for selecting elements instead of CSS classes, which might change. Include explicit waits in scripts for variable load times; do not assume instant element appearances. Set realistic alert thresholds based on performance data; alerting at 3 seconds for a normally 2-second page is logical, but 2.1 seconds creates noise. Use multiple test locations so temporary regional network issues do not trigger false alerts. Alert only after multiple location failures. Maintain monitors as applications change; update synthetic checks when you update your site. Promptly review failures to distinguish real issues from script problems. Tag and organize monitors by team, service, or environment for easy management. Document what each monitor tests and its importance, aiding team understanding. Avoid monitoring third-party services unless tracking their reliability is necessary. Do not perform excess checks, as this wastes resources and creates unnecessary system load.
End
New Relic Synthetics offers comprehensive performance monitoring with automated testing from global locations. The service assists development teams and businesses in identifying issues before impacting real users, with a range of monitor types from simple pings to complex scripted browser tests simulating full user journeys. Its tight New Relic APM and observability platform integration is highly valuable for existing New Relic tool users, correlating synthetic test results with application traces, infrastructure metrics, and logs in one interface. While alternatives like Datadog, Pingdom, and Uptime Robot offer similar capabilities, New Relic Synthetics excels in scripting strength and platform synergy. User-agent identification, flexible alerts, and detailed performance metrics support teams in maintaining reliable applications. Achieving success in synthetic monitoring involves selecting apt monitor types, setting suitable check frequencies, configuring meaningful alerts, and maintaining scripts as applications evolve. Thoughtful implementation makes New Relic Synthetics an essential tool for maintaining application reliability and performance.
Frequently Asked Questions
What types of checks can I perform with New Relic Synthetics?
New Relic Synthetics supports several types of checks, including ping monitors for basic uptime verification, simple browser monitors for loading web pages, scripted browser monitors for complex user interactions, and API monitors for testing service endpoints. This variety allows users to address different monitoring needs effectively.
How do I set up my first monitor?
You can set up your first monitor by navigating to the Synthetics section of the New Relic platform, clicking "Create monitor," and selecting the desired monitor type. After entering the URL, choosing test locations, and configuring frequency and alert conditions, save the monitor to start receiving results shortly thereafter.
How does New Relic Synthetics integrate with other New Relic tools?
New Relic Synthetics integrates seamlessly with New Relic APM, allowing users to view application performance data alongside synthetic monitoring results. This integration helps correlate failures detected by synthetic checks with specific application code or infrastructure issues, enhancing overall observability.
What are the best practices for using synthetic monitoring effectively?
Best practices include focusing on high-value user journeys, writing stable scripts that accommodate minor changes, and using realistic alert thresholds. Additionally, maintain monitors regularly as applications evolve, and utilize multiple test locations to avoid false alerts from transient regional issues.
How does pricing work for New Relic Synthetics?
Pricing is based on the number of monthly checks, with each monitor execution counting as one check. Costs vary depending on check frequency, monitor types (e.g., scripted checks are typically priced higher), and the use of private locations, which may involve additional fees.
Can New Relic Synthetics help prevent performance issues before they affect users?
Yes, synthetic monitoring helps identify potential performance issues by continuously testing systems even when real user traffic is low. By catching problems early, businesses can address them proactively, ensuring a better experience for end users.
What should I do if a synthetic test fails?
If a synthetic test fails, review the alert notifications and the detailed performance data collected during the test. Analyze the logs, screenshots, and error messages to determine whether the issue originates from the website itself or if it is related to the synthetic monitoring script.
Track Your AI Visibility
See how AI chatbots like ChatGPT, Claude, and Perplexity discover and recommend your brand.