Pingdom Bot Guide: SolarWinds Monitoring Crawler Features
Learn how Pingdom bot works for website monitoring. Covers user-agent strings, blocking options, and performance tracking features.
Introduction
Website monitoring tools are essential to keep sites running smoothly by checking their uptime and load speeds. The Pingdom bot developed by Pingdom, a SolarWinds company, is a crucial website performance crawler that monitors website performance and uptime. This bot operates globally, reporting on speed, availability, and potential issues. Tools like the Pingdom bot exist because businesses need immediate alerts when they experience downtime or slow performance. Every minute of downtime can be costly and damage a company’s reputation. Key features of the Pingdom monitoring bot include synthetic monitoring, real user monitoring, page speed analysis, and transaction monitoring. These features run automated checks at regular intervals to ensure web services remain operational.
What is Pingdom Bot
Pingdom Bot Monitoring Process:
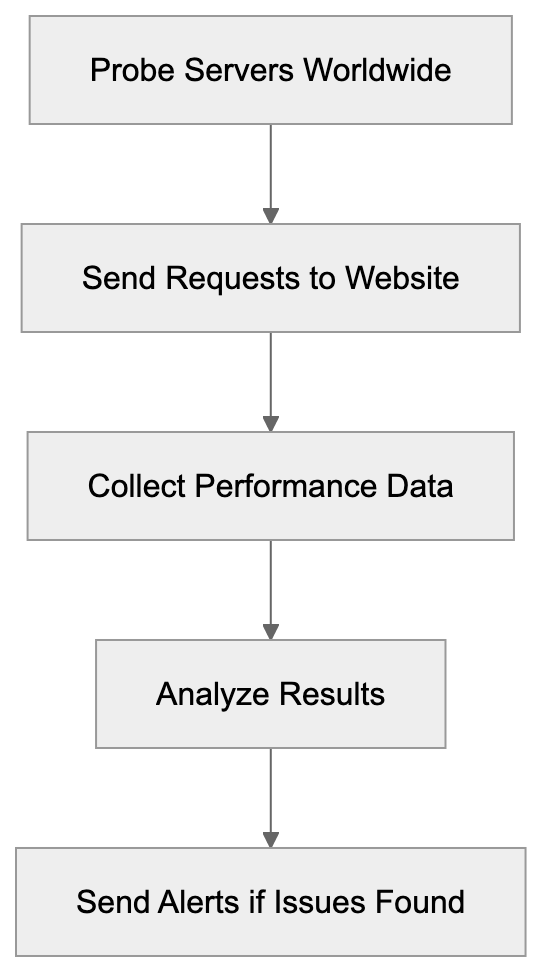
The Pingdom bot is an automated monitoring bot owned by Pingdom, part of SolarWinds’ portfolio. It visits websites and web applications to assess their availability and performance. When monitoring is set up through Pingdom, requests are sent from multiple probe servers worldwide, simulating real user visits to the site. The bot collects data on response times, page load speeds, and the loading of all page elements. Additionally, it reviews SSL certificates, DNS resolution times, and server response codes. Identified through a unique user-agent string, the bot can be recognized in server logs. Monitoring occurs continuously at configurable intervals, usually ranging from one minute to one hour between checks.
User-Agent String Details
The Pingdom bot uses a specific user-agent string to identify itself during website crawls, as explained in User-Agent header. The standard user-agent appears as: “Pingdom.com_bot_version_X.X.” Variations may include geographic identifiers for the probe location. Other user-agent strings like “PingdomTMS” and “PingdomPageSpeed” are used for transaction monitoring and page speed checks. Website administrators can locate these strings in web server access logs, differentiating Pingdom checks from human visitors. Knowing the user-agent string is crucial for two reasons: it ensures bot visits are not counted as real user traffic in analytics, and it allows web servers or firewalls to be configured to allow or block specific user-agents as needed.
Why Pingdom Bot Exists and Its Purpose
Websites require constant monitoring due to the possibility of unforeseen issues like server crashes, network problems, coding errors, or traffic spikes. The Pingdom bot is designed to detect these issues before customers are impacted, alerting the appropriate personnel immediately, as discussed in Pingdom’s blog. Downtime directly affects revenue, especially for e-commerce sites when checkout pages fail to load, and SaaS platforms lose subscriber trust if services go offline. Even informational sites suffer when search engines notice frequent downtime and lower their rankings. Global checks from the bot help identify regional outages, CDN failures, or DNS issues. The data collected assists developers in enhancing load times and user experience.
How Companies and Users Utilize Pingdom
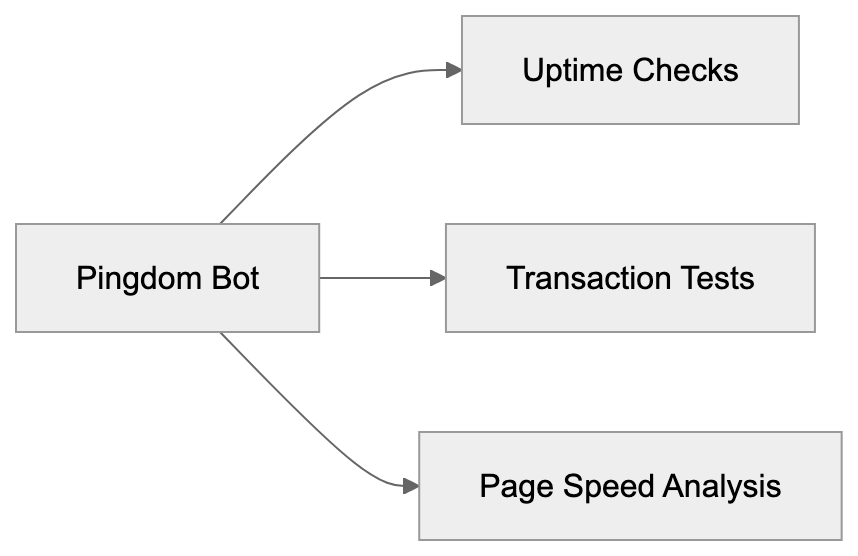
Pingdom Bot Check Types:
Companies use the Pingdom bot in various ways. Development teams set up uptime monitoring for production websites, receiving alerts when sites go down. The monitoring intervals are based on the service’s importance; mission-critical applications may be checked every minute, while less critical sites every five or ten minutes. DevOps teams leverage transaction monitoring to test user workflows, from logging in to checkout completion. If a step fails, notifications are sent immediately. Marketing professionals monitor landing page performance to ensure successful campaigns, as slow loading affects conversion rates. SolarWinds’ 2019 acquisition of Pingdom enriched their IT infrastructure management portfolio, which includes network, server, and application performance monitoring tools.
Blocking Considerations for Pingdom Bot
Website owners may question whether to allow or block the Pingdom bot. If Pingdom is used for self-monitoring, the bot should be allowed; blocking would prevent monitoring checks. Whitelisting the bot involves allowing its user-agent strings and IP addresses through firewall or security rules. Pingdom provides a list of probe server IP addresses for reference. However, if Pingdom is not used and it appears on your site, competitors might be monitoring your performance. In this case, you could block the bot using web server configurations, firewall rules, or robots.txt, although robots.txt is merely a suggestion that can be ignored. Effective blocking uses IP addresses or user-agent filtering at the firewall or server level.
Pingdom Features and Capabilities
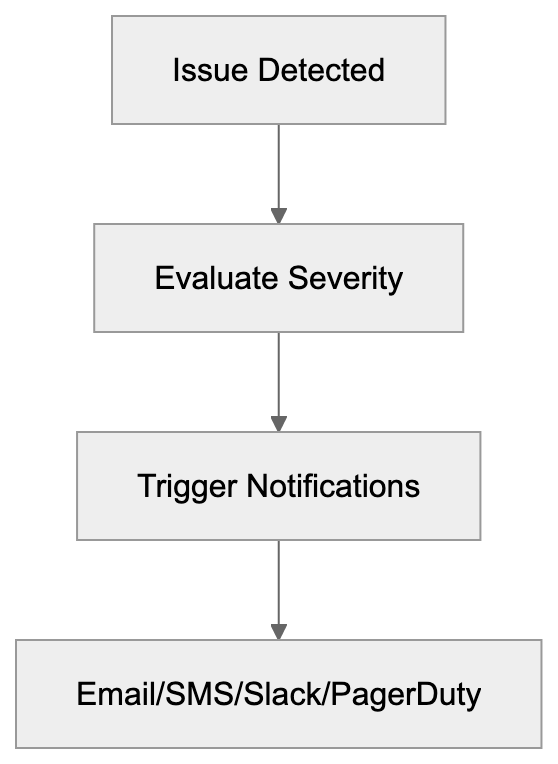
Pingdom offers multiple monitoring types beyond basic uptime checks. Synthetic monitoring tests site availability from over 70 global locations. You can select specific regions vital to your business. Real user monitoring gathers performance data from actual visitors using JavaScript embedded on pages, illustrating users’ experiences on different browsers, devices, and connections. Page speed monitoring identifies page slowdowns, recommending improvements by analyzing elements like images, scripts, and stylesheets. Transaction monitoring ensures complex user processes operate correctly. Notifications via email, SMS, Slack, PagerDuty, or webhook integrations keep teams informed, with escalation rules directing alerts based on severity or time.
Comparing Pingdom to Alternative Monitoring Tools
There are several alternatives to the Pingdom bot in the website monitoring domain, each with unique features:
| Tool | Probe Locations | Check Interval | Free Tier | Notable Features |
|---|---|---|---|---|
| Pingdom | 70+ | 1 min | No | Extensive transaction monitoring, RUM |
| UptimeRobot | 50+ | 5 min | Yes (50 monitors) | Status pages, keyword monitoring |
| StatusCake | 60+ | 1 min | Yes (10 monitors) | Virus scanning, domain monitoring |
| Site24x7 | 100+ | 1 min | Yes (3 monitors) | Full stack monitoring |
| Better Uptime | 30+ | 1 min | Yes (50 checks) | Incident management, on-call scheduling |
Alert Notification Flow:
Pingdom stands out for its extensive feature set and probe network. Backed by SolarWinds, it integrates seamlessly with other infrastructure tools, despite its lack of a free tier, unlike UptimeRobot or StatusCake. Small developers might find free alternatives sufficient, but larger enterprises often choose Pingdom for its reliability, thorough reporting, and advanced transaction monitoring capabilities. Site24x7 offers comparable features with superior value for current users of their other monitoring products, while Better Uptime emphasizes incident management processes alongside basic monitoring.
Technical Implementation Details
Setting up Pingdom monitoring involves adding checks via their web interface. Specify the URL, check interval, and selected prob locations. Basic HTTP checks involve requesting your URL and confirming a successful status code. Advanced checks support POST requests, custom headers, and authentication credentials. For transaction monitoring, record and replay browser sessions for testing. Real user monitoring requires a JavaScript snippet on web pages to collect visitor performance metrics, returning data to Pingdom servers. Integration with incident management tools is via webhooks or direct integrations. Alert-triggering is customizable, and the API allows programmatic monitoring data retrieval for custom dashboards or reports.
Managing Server Load from Monitoring Bots
Regular monitoring checks can add load to web servers. Checks every minute from multiple locations create consistent traffic. For most sites, this load pales compared to actual user traffic, though high-traffic or resource-heavy sites might need optimization. Adjusting check frequency or monitoring lighter endpoints can reduce load significantly. Dedicated monitoring endpoints might provide basic health status, and using a CDN or caching layer to handle monitoring requests can alleviate server pressure. This strategy ensures the CDN’s function but might not catch origin server issues masked by caching. Balancing monitoring thoroughness and server load depends on the site’s specific circumstances.
Privacy and Data Collection Aspects
The Pingdom bot collects data on website performance and availability, including response times, status codes, page content, and error messages. When monitoring your sites, the data collected is controllable via check configurations and stored on SolarWinds servers for analysis. If someone else monitors your site via Pingdom, they only see public page content without authentication access. Failed login attempts from Pingdom IPs might occur if trying to monitor protected pages. Real user monitoring through JavaScript gathers detailed visitor data, such as browser type and location. This requires privacy policy disclosure and possible GDPR compliance based on local laws and SolarWinds agreements.
Troubleshooting False Positives
Occasionally, monitoring bots report nonexistent issues, called false positives, wasting time and reducing alert efficiency. Common causes include sensitive thresholds, temporary network glitches, or bot blockages. Setting alert sensitivity prevents network hiccups from triggering false notifications. Geographic false positives may arise from a specific probe location failing. Confirm genuine regional problems by reviewing locations reporting failures. SSL certificate warnings could stem from cache issues. Validate SSL configurations independently to ensure accuracy. Firewalls might block Pingdom checks, unlike regular traffic. Reviewing firewall logs and adding Pingdom IPs to whitelists ensure effective monitoring.
Conclusion
The Pingdom bot, a crucial website performance crawler, functions as a website monitoring tool for SolarWinds customers. It regularly visits sites from multiple global locations to quickly identify outages and slowdowns, distinguishing itself through specific user-agent strings in server logs. Website owners using Pingdom need to allow the bot access through security systems; others may choose to block it. Businesses utilize it for uptime monitoring, transaction testing, and performance improvement. While Pingdom lacks a free tier, its extensive features and probe coverage make it a preferred choice for many, aiding development teams in maintaining web services and enhancing user experience.
Frequently Asked Questions
How can my business benefit from using the Pingdom bot?
The Pingdom bot helps businesses maintain optimal website performance by continuously monitoring uptime and load speeds. With immediate alerts for downtime or slow performance, it allows teams to address issues quickly, minimizing potential revenue losses and improving customer trust.
What should I do if I notice Pingdom bot activity in my server logs?
If you are using the Pingdom service, it’s important to allow this bot to access your site so that monitoring can occur. However, if you’re not using Pingdom and you see activity from their bot, it might be competitors monitoring your site, and you can choose to block it using firewall rules or IP filtering.
What types of monitoring does Pingdom provide?
Pingdom offers several types of monitoring, including uptime monitoring to check website availability, real user monitoring for gathering data on actual visitors, and transaction monitoring to simulate user journeys. Each of these helps ensure that different aspects of website performance remain optimal.
Can I adjust how often Pingdom checks my website?
Yes, Pingdom allows you to configure the check interval based on the importance of your site. For critical applications, checks can be set as frequently as every minute, while less critical sites could be monitored every five to ten minutes.
Is my data safe when using Pingdom for monitoring?
Yes, the data collected by the Pingdom bot, such as response times and page performance, is stored on SolarWinds servers for analysis. Only publically accessible data is visible to external users monitoring your site, ensuring sensitive information remains private.
What can I do about false positives in monitoring alerts?
To reduce false positives, you can adjust the alert sensitivity settings within Pingdom. It's also helpful to review geographic failures when they occur and ensure that Pingdom's IPs are whitelisted to prevent blockages by your security settings.
Does Pingdom offer any support for integration with other tools?
Yes, Pingdom supports integration with various incident management tools through webhooks and direct integrations. This ensures that your teams receive timely alerts via their preferred channels, such as email, SMS, or collaboration tools like Slack.
Track Your AI Visibility
See how AI chatbots like ChatGPT, Claude, and Perplexity discover and recommend your brand.